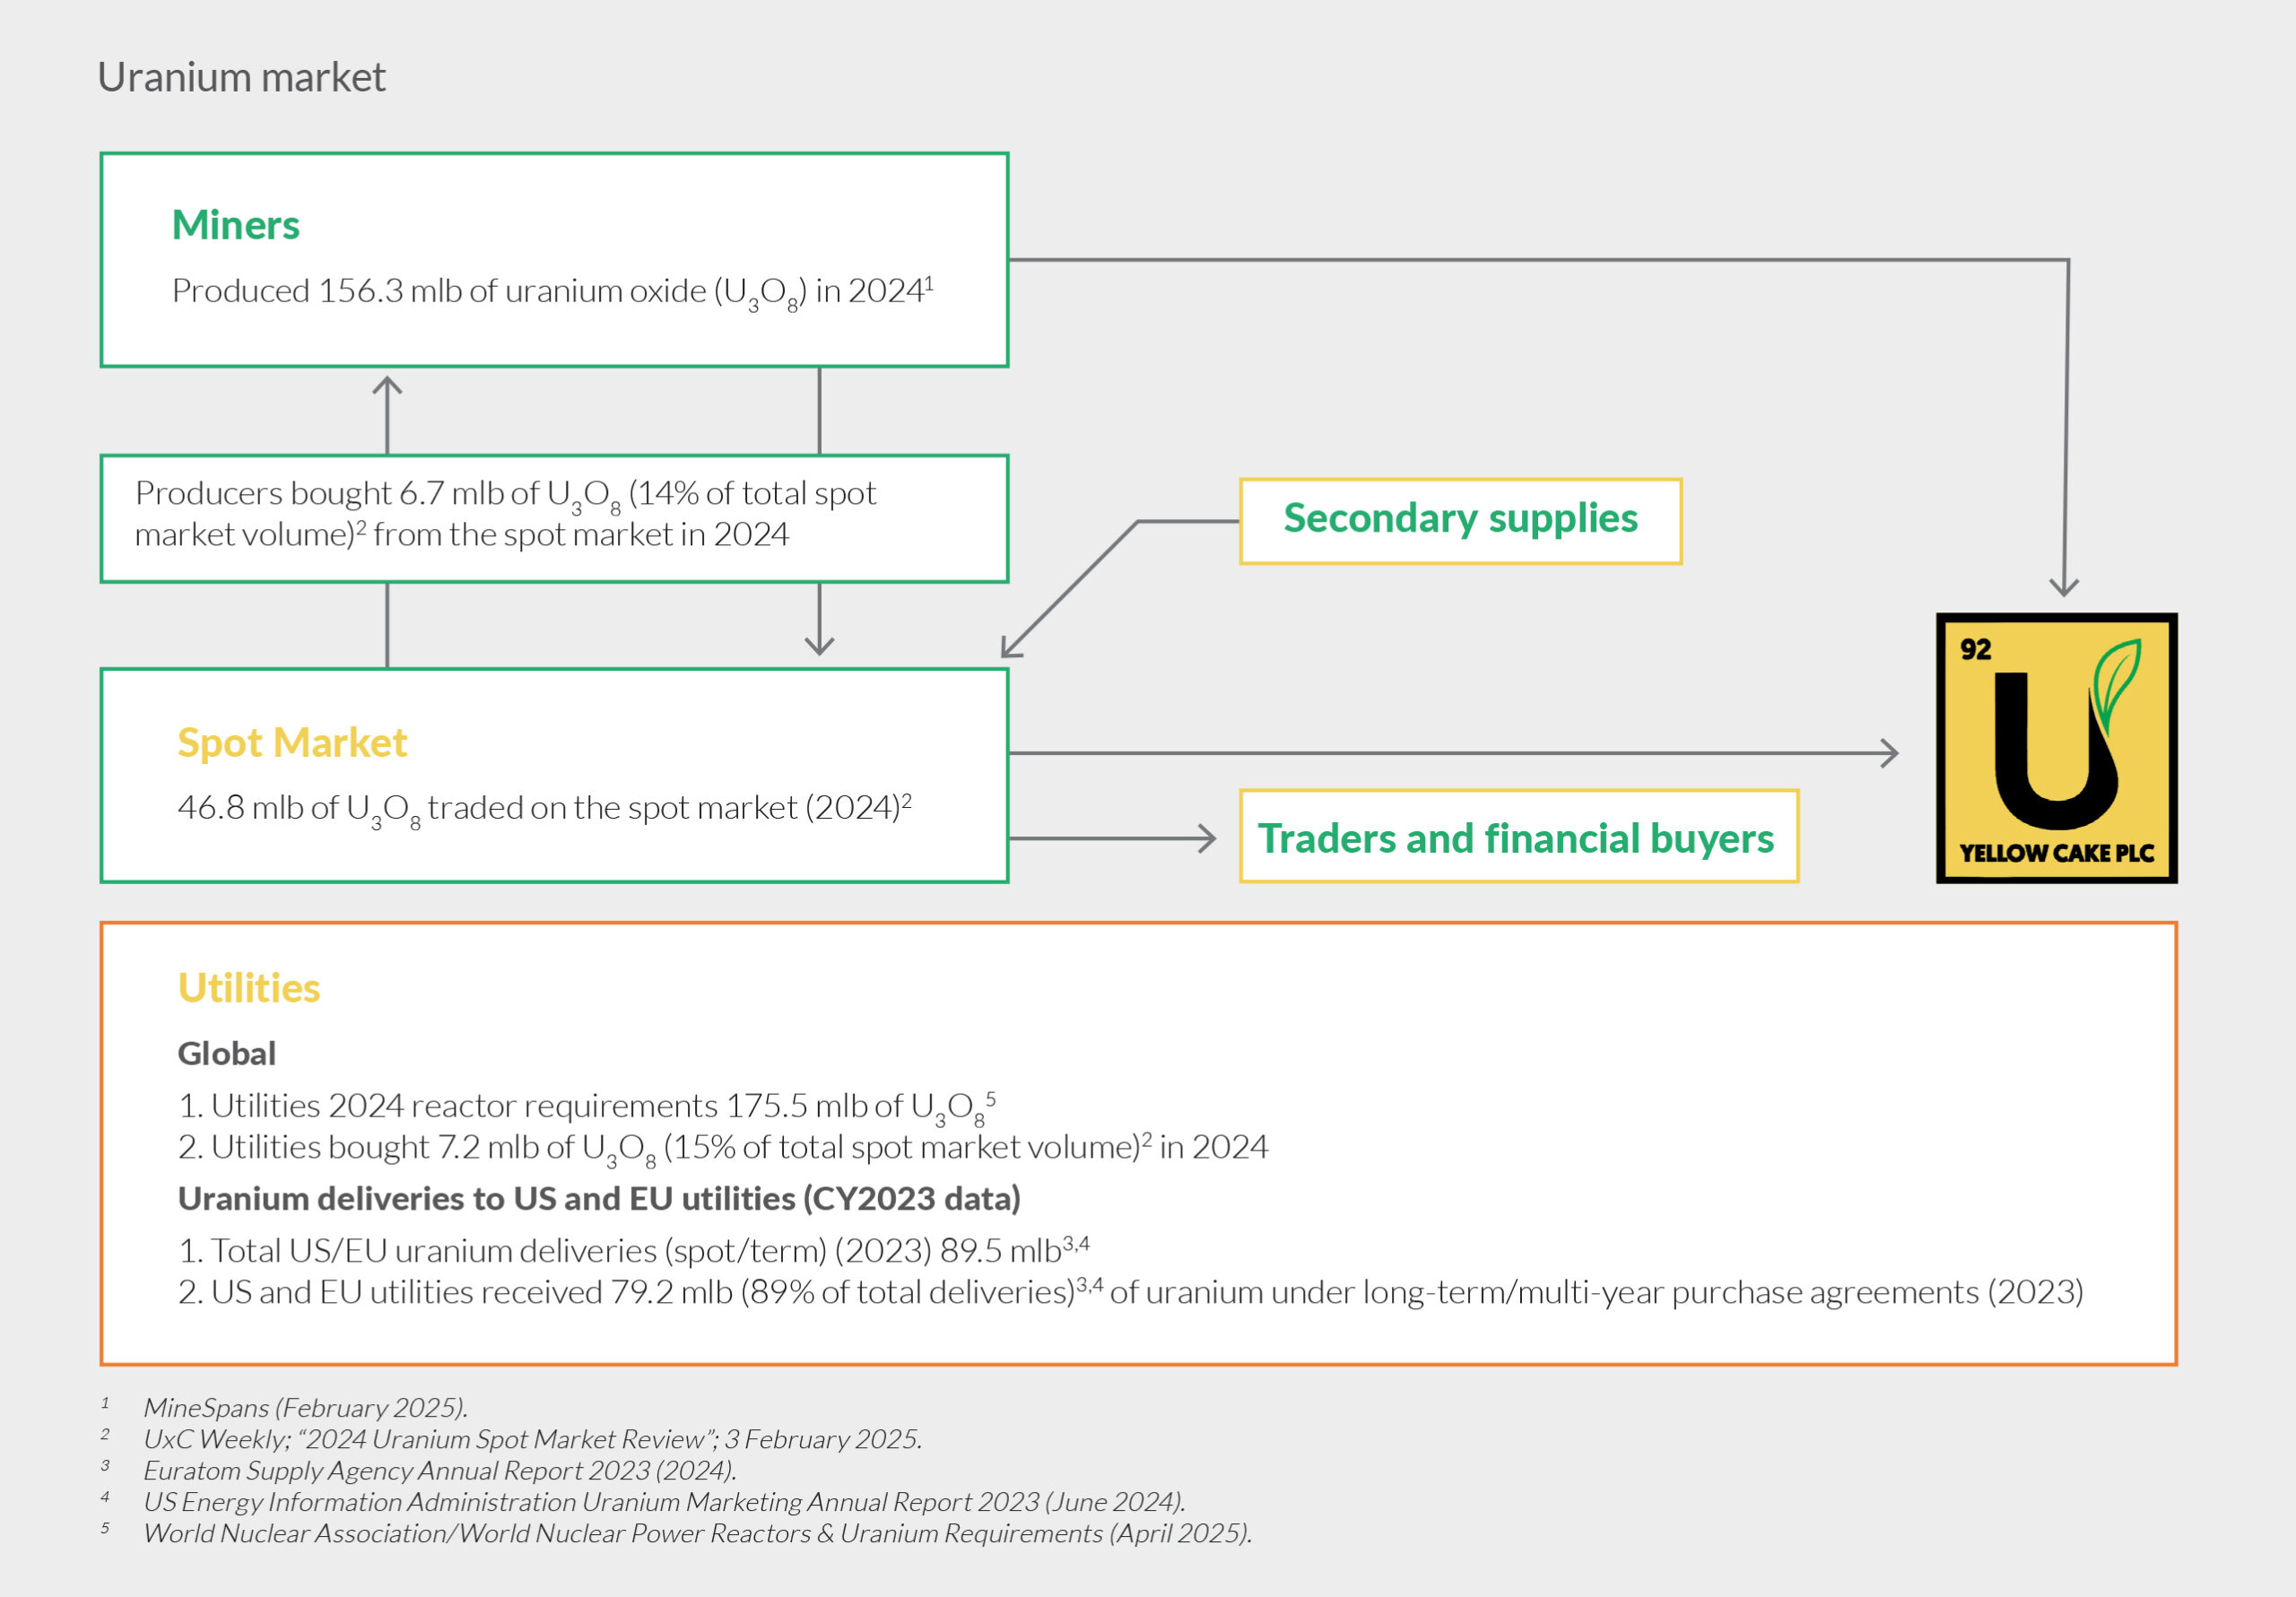
Home / Uranium market
Since 2018 the sentiment towards nuclear energy has improved in the context of net zero carbon commitments, concerns around concentration of supply and an increased focus on energy security following Russia’s invasion of Ukraine. The U3O8 price has started to respond positively as the supply/demand imbalance has become more widely recognised.
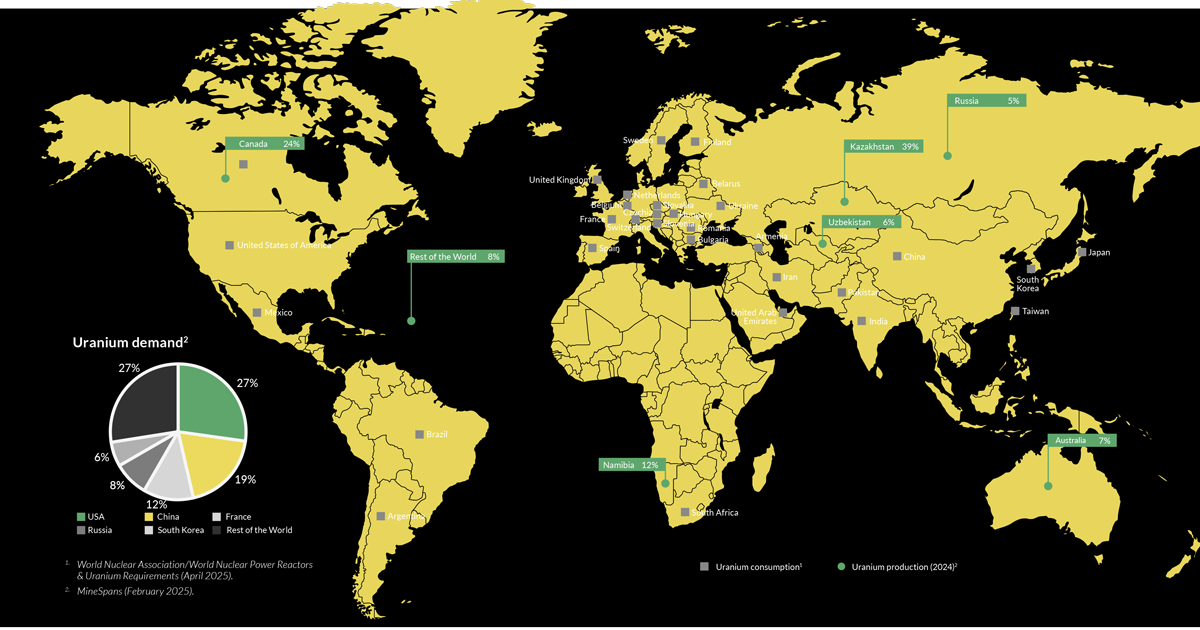
Uranium consumption*World Nuclear Association/World Nuclear Power Reactors & Uranium Requirements (May 2023)
Uranium production (2022) *UxC Weekly, 2022 U3O8 Production Review, 15/05/23

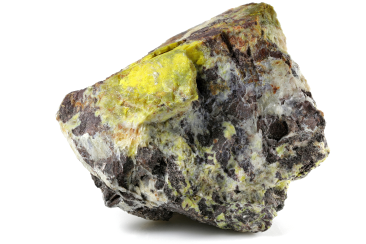
Uranium is mined using in-situ leaching, open pit and underground mining.


Heat from nuclear fission produces steam that drives turbines to generate electricity.